
What You Spend, What You Get Back: 9 Ways to Actually Calculate Marketing ROI
A bilingual explainer covering nine approaches to measuring marketing ROI, including multi-touch attribution, marketing mix modeling, CLV, incrementality testing, and pipeline metrics for B2B.
A couple of days ago, a friend of mine who works in marketing invited me to dinner. The food had barely hit the table before he started sighing.
His boss had asked him a question at last week's meeting: the marketing department spent 800,000 yuan this month — how much revenue did it bring in?
He froze. He had a pile of data at his fingertips: click-through rates up 30%, his WeChat official account posts breaking 100,000 reads, record viewership on his livestreams. But the boss asked about revenue. He couldn't answer.
I told him: you're not alone. The vast majority of marketers can't answer that question either.
What Is Marketing ROI?
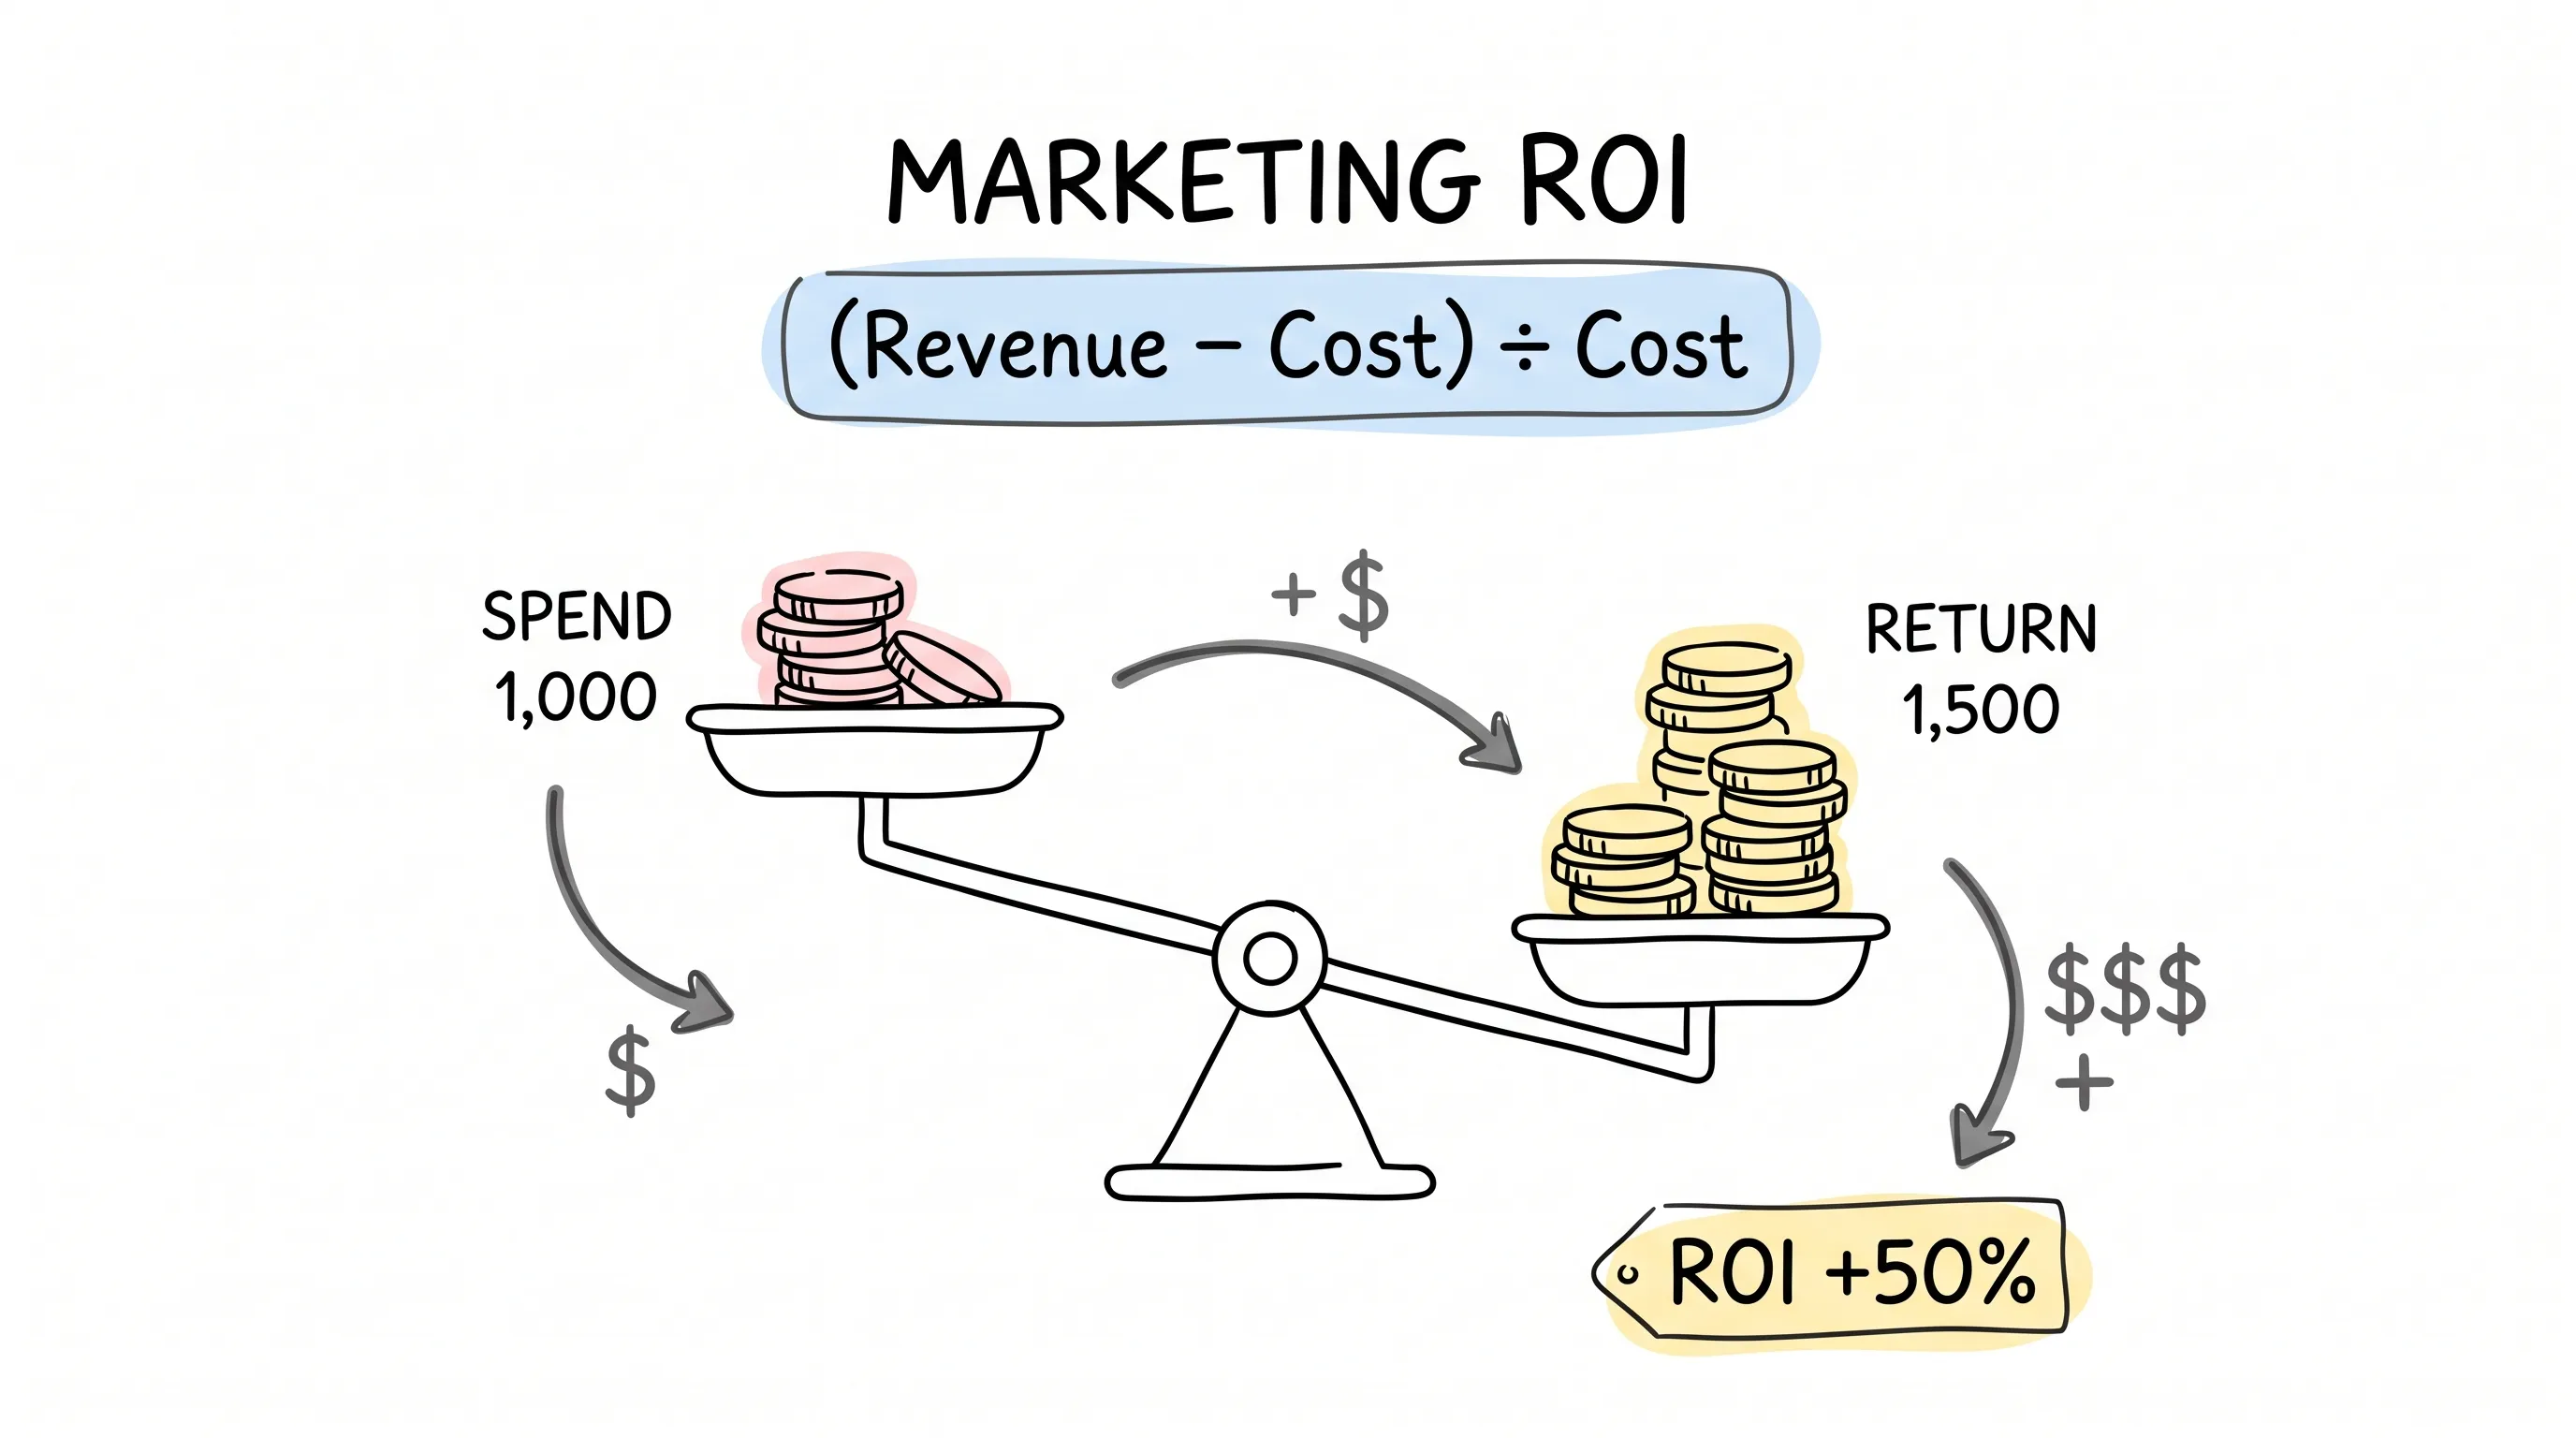
ROI — return on investment. The formula couldn't be simpler:
(Revenue − Cost) ÷ Cost.
Spend 1,000 yuan, get back 1,500, and your ROI is 50%.
So think about it: if the formula is this simple, why can most teams never get the math right?
The formula isn't the hard part. What's hard is that the two numbers — "revenue" and "cost" — are unreliable in themselves.
Some returns come fast. A customer places an order, signs up, starts a paid subscription — it lands in the report that same month.
Other returns come slow. Brand awareness, retention, repeat purchases, and in B2B, that sales pipeline that drags on for the better part of a year. That's money too, but it won't show up in the closed-won records right away.
You have to count both ends to get the math right. But how?
I came across a stat I found interesting: 85% of marketers believe they've got ROI figured out. But only 32% can actually measure online and offline under one roof.
The gap between confidence and reality is a whole ocean wide.
So here are the 9 ways to get marketing ROI right, one by one. Nothing mystical — all of them are actionable.
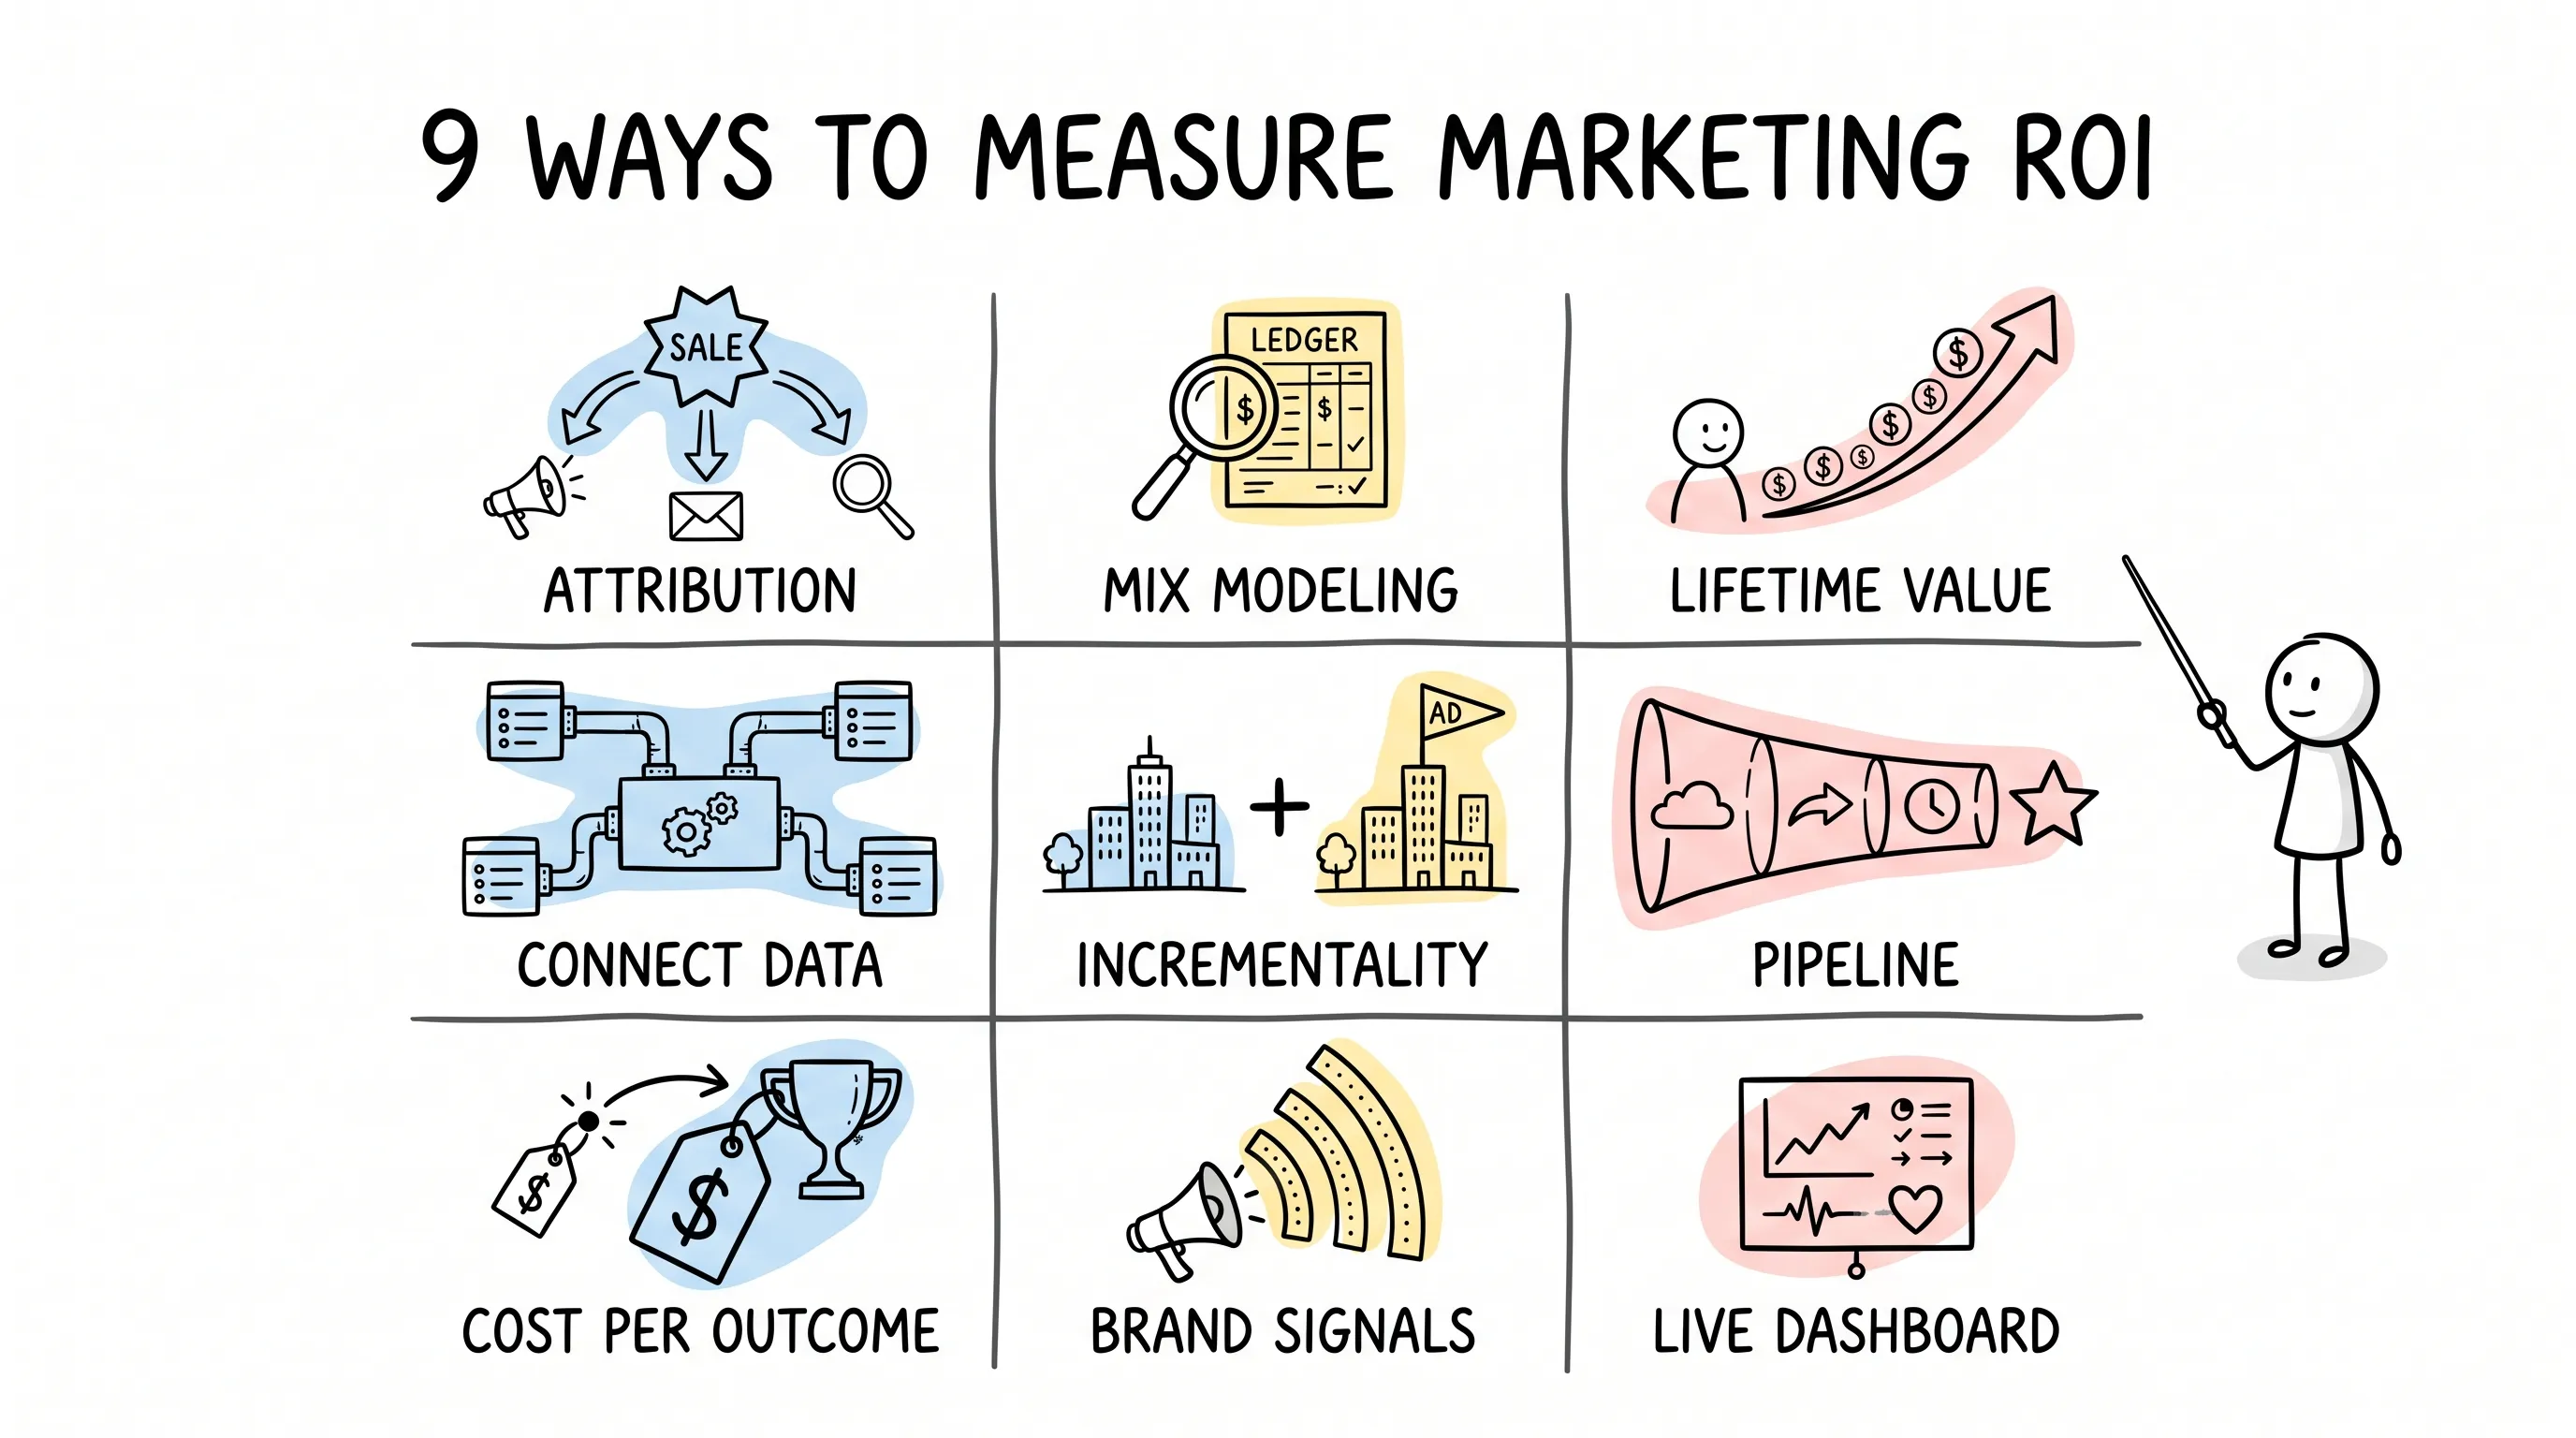
1. Multi-Touch Attribution: Don't Give All the Credit to the Last Click
What is multi-touch attribution?
Think back to the last time you bought something. Did you see an ad and buy it on the spot? Probably not. You scrolled past an ad, read a review, compared prices — and in the end, it may have been a friend's single recommendation that closed the deal.
Customers are the same. Between seeing an ad and pulling out a wallet, there might be seven or eight touchpoints.
Take this user: on Monday he scrolls past your Facebook ad and doesn't click. On Thursday he opens your email newsletter and reads an article. Two weeks later, he types your brand name into the search box and buys.
If you keep score by "last click," 100% of the credit for that sale goes to the search. The ad and the email? All that work counts for nothing.
Is that fair? Of course not. And that's how budgets get cut the wrong way: ads get shut off, emails stop going out, and the next round of search conversions disappears with them.
Multi-touch attribution (MTA) splits the credit for each sale across every touchpoint, by contribution. How much goes to the ad, the email, the search — all laid out on the table.
And AI now does this at an even finer grain: across devices, across channels, even offline actions can be stitched together while protecting user privacy.
2. Marketing Mix Modeling: Zoom Out and Look at the Whole Ledger
Attribution looks down, tracking each individual user's footsteps. Marketing mix modeling (MMM) looks up at the whole ledger.
What does it do? It lays out your historical operating data and estimates how much revenue each channel contributed.
For example, MMM might tell you: your organic search and social media steadily contribute 20% of baseline revenue even if you spend nothing on ads there. That's your foundation.
Meanwhile, you bump your Google Ads spend by 20%, and revenue only rises 5%.
Why? Because that channel is near saturation. Pour in more money and the splash keeps getting smaller.
Attribution can't see either of these signals. Brand awareness from organic search leaves no click path to trace; diminishing returns never show up in a last-click report.
Seasonality, pricing, the economy, competitors' moves — MMM factors all of it in.
Attribution handles the micro; MMM handles the macro. Use both together and the ledger finally has depth.
3. Customer Lifetime Value: Count the Person, Not Just the Sale
What is customer lifetime value (CLV)?
It means stop fixating on a single transaction and look at how much money one customer will bring you over a lifetime.
Let me run the numbers for you. Customers who come in through email and membership programs spend an average of 600 yuan over two years — and they keep coming back. New customers pulled in by discount ads spend an average of only 150 yuan, buy once, and leave.
Judged by first-order cost, the discount ads might even look cheaper. But look at the total ledger? Who's making you money becomes obvious at a glance.
That's why some campaigns look expensive to acquire but are actually good, and some campaigns look profitable on the first order but turn out to be losses when you stretch the view to two years.
Once you measure ROI through CLV, what you care about changes: no longer just acquisition, but retention, repeat purchases, and the relationship with the customer.
4. Connect Your Data: Islands Don't Add Up to a Continent
Plenty of teams can't calculate ROI — not because they lack data, but because none of the data speaks to the rest.
Your CRM records customers, ad platforms record clicks, email tools record opens, e-commerce platforms record orders. Each in its own silo, ignoring all the others.
The result: when a deal closes, you can't say which campaign brought it in. When credit can't be assigned, budgets come down to gut calls.
So connect the pipes. Take a data integration tool like Windsor.ai — it ships with 350+ ready-made connectors that funnel customer data from HubSpot and Salesforce, and campaign data from Google Ads and Meta Ads, all into one place like BigQuery, Looker Studio, or Power BI. No code required.
Once the data flows, you stop guessing which campaign produced which deal. Where value is growing becomes visible at a glance.
5. Incrementality Testing: Strip Out What Would Have Happened Anyway
You ran an ad campaign and sales rose that month. Was the money well spent?
Hold on. Is it possible sales would have gone up even without the ads? What if it was peak season? What if the platform was running a big sale?
Incrementality testing exists to answer exactly that. There are several methods: A/B tests, holdout groups, geo experiments.
Here's the most intuitive one: pick two sets of similar cities, run ads in one, firmly don't in the other. After a month, compare sales. That difference is the true incremental lift the ads delivered.
The excess is you booking sales that would have happened anyway under your own name.
Today's tools can run these tests automatically, over and over. Real demand finally separates from seasonal swings and natural growth.
Clean numbers make for confident decisions.
6. For B2B, Watch the Pipeline: No Deal Yet Doesn't Mean No Value
If you're in B2B, I need to flag this one specially.
How long is a B2B sales cycle? Nine months is normal, with five or six people on the decision chain. If you evaluate marketing campaigns solely on "how many deals closed this quarter," marketing takes the fall for nothing.
Say a LinkedIn ad campaign plus an industry webinar closed zero deals this quarter. But in the 9-month sales pipeline, it opened the door to 20 qualified opportunities. That deal simply hasn't reached harvest season yet.
So what do you measure? Pipeline contribution: how many qualified opportunities opened, whether win rates are higher on deals marketing touched, whether sales cycles got shorter.
Closed deals are a lagging indicator. Pipeline is the leading one.
7. Cost per Outcome: Don't Get Fooled by Cheap Clicks
What is "cost per outcome"?
It means don't measure cost per click — measure it per meaningful outcome: how much per qualified lead, per booked demo, per paying conversion.
Let me run the numbers so you can feel it.
Campaign A: 2 yuan per click. Cheap, right? But the lead-to-demo conversion rate is only 0.5%. At 1,000 clicks you spend 2,000 yuan and get 5 demos. That's 400 yuan per demo.
Campaign B: 5 yuan per click — more than double. But the conversion rate is 4%. The same 1,000 clicks cost 5,000 yuan and produce 40 demos. That's 125 yuan per demo.
The same money buys 35 more demos with B. Frustrating, isn't it?
The cheaper the click, the more expensive it turns out to be. A campaign that looks pretty in the report may be quietly bleeding money. Plenty of tools today can automatically map spend onto these deeper outcomes, so you don't optimize your way down a path of cheap but useless traffic.
8. Don't Forget the Returns That Don't Turn Into Money Right Away
Some returns never show up as revenue immediately. But they're laying the foundation for future revenue.
Brand trust, brand awareness, share of voice, customers recommending you unprompted. None of these have a unit price on any report, yet they're real.
How do you judge whether a brand campaign was worth it? Look at quantifiable indirect signals.
Say a brand campaign produces almost no conversions in the current period — but next quarter, noticeably more people are searching your brand name. That's a tangible return; it's just one a last-click report will never display.
So mature teams score revenue metrics and strategic impact side by side. Don't let campaigns that are "paving the road ahead" die under a "no conversions this month" review.
9. Real-Time Dashboards: Don't Wait for the Weekly Report — Watch It Live
Last one.
Static reports can't keep up with the pace of media buying. By the time the weekly report comes out and you adjust, the money's already been burning for a week.
Real-time dashboards pull data from ad platforms, CRM, e-commerce, social, and finance systems into one place you can check anytime. Which campaign is losing money — shut it down that day. Which channel is working — raise its budget that day.
You can now go a step further: pipe your business data into large models like ChatGPT, Claude, or Gemini and just ask in plain language: "Over the past 30 days, which channel's customer acquisition cost is rising?" Answers come back in seconds — no waiting for an analyst to run the numbers.
Spend the saved time on the work that actually needs a human brain: judgment and decisions.
A Few Common Questions, Answered While We're Here
What about offline spend? TV, out-of-home, subway ads — there's no click to track.
Right, no clicks, so you can only estimate, not measure. Three ways: build an MMM model; assign each campaign an exclusive promo code or landing page; run geo experiments, comparing cities that got the ads against cities that didn't. And when you report the number, give a range. Don't fake precision — with a modeled figure, precision is an illusion.
My boss doesn't trust marketing's numbers. What do I do?
Two steps. First, stop reporting clicks and impressions; report the numbers your boss and finance already trust: cost per qualified lead, cost per demo, contract value signed. Second, run one small-scale incrementality test. Then when he asks, "Would this revenue have come in anyway without the ads?" — you have data, and you don't have to argue.
There are so many tools. How do I choose?
A typical stack has three layers. Bottom layer: data integration — pool data from ads, CRM, and analytics in one place, like Windsor.ai mentioned earlier. Middle layer: attribution or MMM — figure out how credit gets split. Top layer: dashboards — tell the story to humans. GA4, HubSpot, Salesforce, Mixpanel, Adobe Analytics each cover a segment. Remember one principle: connect the data first, then analyze. Get the order backwards and everything is a castle in the air.
We operate in multiple regions and lines of business. How do we calculate?
Separately. Each region and each business line gets compared against its own baseline — never blended into one big average. Acquisition costs, conversion rates, and sales cycles vary wildly between cities; once you average them, the losing regions hide behind the winning ones. One prerequisite: UTM and CRM tagging has to be consistent, otherwise you can't split them even if you want to.
Finally, Back to That Friend from the Beginning
Last week he invited me to dinner again. This time, no sighing.
He said these days his meetings with his boss cover only three things: how much we spent this month, how much contract value it brought in, and the cost per demo. The boss has never asked "where did the money go" again.
In marketing, the thing to fear was never spending money on the wrong thing. It's spending money and being unable to say where it went — so next month, you can only keep spending on gut feel.
Between "I think it's working" and "I know it's working," the difference comes down to exactly one thing: whether you've done the math.
May every yuan you spend carry a clear account of where it came from — and a clear road ahead.
Continue reading
Related articles

Cross-Border Business: Time to Upgrade Your AI Toolbox
A learn article explaining how AI tools help cross-border e-commerce sellers clear five hurdles: language, regulation, logistics, payments, and fraud. It outlines a five-compartment toolbox, a five-step adoption path, and metrics such as conversion rate and CLV, while cautioning against over-reliance on AI.

AI Is Taking Over the Dirty Work of Social Media Marketing, One Task at a Time
This learn article outlines four social media marketing tasks AI can handle — audience analytics, content drafting and design, ad targeting and creative testing, and spam moderation — and cautions that taste, judgment, and data security remain human responsibilities.

AI Is Already This Good — Why Is Your Social Media Marketing Still Pure Manpower?
An overview of 18 AI tools for social media marketing, organized into six categories covering audience research, content creation, scheduling, comment and DM handling, ad management, and visual production, plus notes on personalization, prediction, and emerging trends.