
AI Marketing's Payback Line: 16 Months
A learn article that uses the 16-month median CAC payback benchmark to explain how to judge AI marketing investments, covering ROI attribution gaps, usage-based billing risks, budget allocation toward existing markets, and a pre-signing audit checklist.
A few days ago, I had dinner with an old friend who has spent more than a decade as a CMO.
He'd just come out of a meeting. He dropped into his seat and the first thing out of his mouth was: another AI company came in today, saying they can triple my marketing efficiency.
I asked, so did you buy?
He said, I didn't dare to. But I have no idea how to judge one.
I said, then let me use tonight's dinner to run the numbers for you.
And you should listen in too. Because over the next two years, odds are someone will come to you with the same story.
First, Find a Referee That Predates AI
What is the CAC payback period?
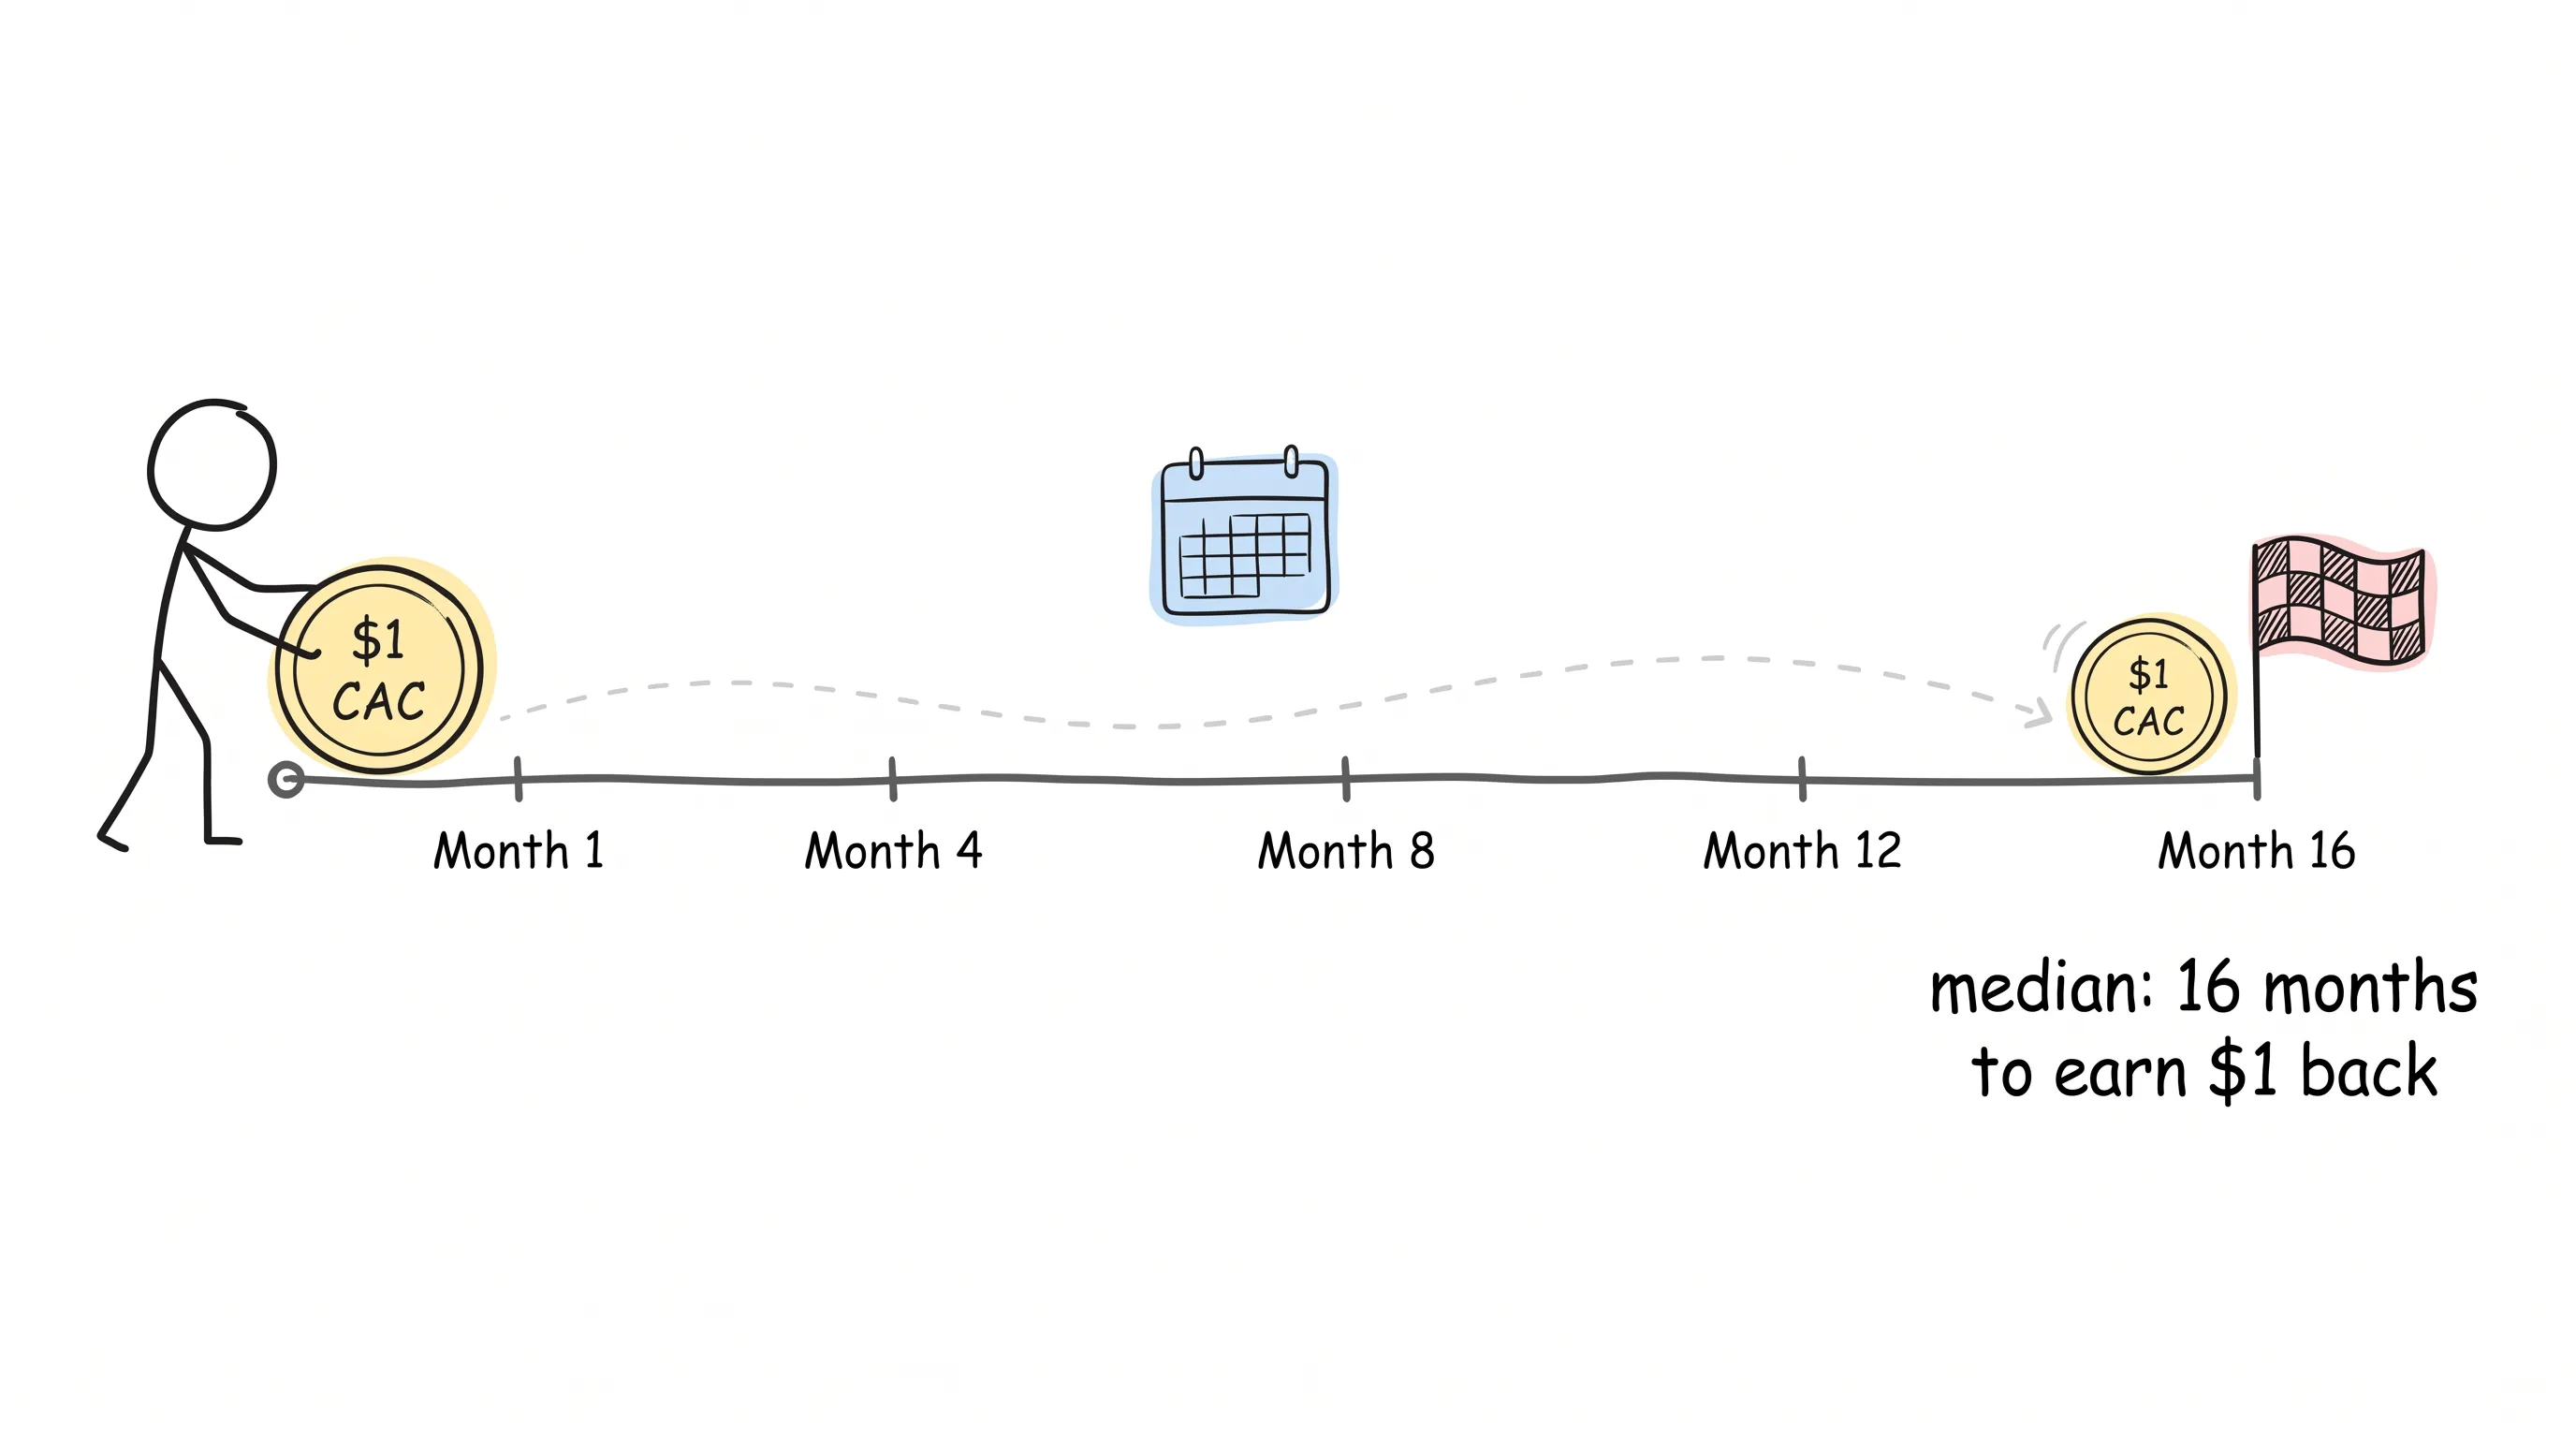
Put simply: you spend one dollar to bring in a customer, and it takes some months before that dollar is earned back from them.
Benchmarkit has published a set of CY-2025 industry benchmarks: the median company takes 16 months. That's down 11% from the previous year's 18.
Break it down and it gets more interesting.
Top quartile: 10 months. Bottom quartile: 24 months. Top performers: under 6 months. The fastest-growing companies pay back in 10 months; the rest need 18.
The top tier sits at 6 months, the bottom at 24. Same game of business — a 4x gap in payback.
Why do these numbers matter?
Because when they were born, nobody had yet come to see you with an AI proposal. They are natural-born referees. An AI project that genuinely improves acquisition efficiency will leave its mark on this number; an AI project that only "produces more content" will leave nothing there at all.
The referee takes the stand before the match begins. Finding one after the match is over isn't officiating — it's excuse-making.
Why Is AI's ROI So Hard to Prove?
In its 2026 report, The CMO Survey asked marketers to rate their own technology skills on a scale of 1 to 7.
Selecting vendors: 4.9. Running systems integration: 4.8. Generating technical ROI: 4.5. Proving technical ROI: 4.2.
Not one clears 5. And compared with 2024, not a single point of improvement.
Sit with that ordering for a second.
What marketers do best is spend money buying things; what they're worst at is accounting for the money they spent.
How bad is 4.2? On a 7-point scale, it's nearly second-to-last in the whole set of questions.
What happens when you build your AI tower on this kind of foundation? AI won't repair your attribution. It will only multiply the things you can't explain.
Utilization Rate Is Not a Report Card
You might say: but everyone is already using it.
Right, they are. The CMO Survey's data: AI now covers 24.2% of marketing activities, up from 13.1%; generative AI has climbed from 7.0% to 22.4% — a 220% increase — and is expected to reach 55.9% within three years.
But Gartner's 2026 CMO Spend Survey shows the other side: marketing technology takes 19.4% of budget, 56% of it billed on usage, while only 9% of the entire tech stack is truly AI-optimized end to end.
What is usage-based billing?
It's how your home electricity meter works: one kilowatt-hour used, one kilowatt-hour paid for.
What does that mean? It means the cost side ticks in real time while the return side grows slowly. The meter doesn't wait until you've made money to keep running.
However many players take the field, that tells you nothing about the score. Utilization rate is not a report card.
The Broader Market Leaves No Room for Trial and Error
Now look at the broader market. Hinge Research Institute's 2026 High Growth Study: median revenue growth for professional services firms is 9.9%, the lowest since 2018.
High-growth firms: 36.6%. Average growth: 8.5%. The zero-growth tier comes in at -11.4% outright.
The profit margin ranking is exactly the same: 39.5%, 29.6%, 20.3%.
More interesting is another set of numbers: high-growth firms spend 12.0% of revenue on marketing; zero-growth firms spend just 5.0%.
See the pattern?
The fastest-growing companies are precisely the ones spending the most.
So if someone tells you "use AI, it can help you save marketing budget," keep your guard up. The direction of that story and the direction the data runs are opposite.
The Other Half of Your Leads
Here's a fact that stings even more.
In that same Hinge report, 39.5% of leads come from referrals; proactive outreach accounts for only 23.5%.
Forty percent of clients arrived through someone else's introduction.
So if you buy an AI specifically to scale acquisition — doing content, doing ad placement, doing traffic — you're optimizing the slice that's under a quarter. And the most crowded slice at that.
Where's the higher leverage?
In that referral forty percent: after a client recommends you, how fast do you respond, and how steadily do you catch what comes in?
Don't fire all your bullets at traffic. Forty percent of leads never walk that road.
Where to Aim the Money
So where exactly should AI be used?
The CMO Survey breaks down companies' growth investment: 56.4% goes to "selling more to existing markets," 22.9% to product development (up from 19.2%), and only 14.1% to new markets (sliding from 17.0%).
Meanwhile, 70.6% of companies say they are shifting toward short-term results. Marketing budget stands at 9.0% of total revenue, up just 1.7% for the year.
How to spend this money — the answer is already written in the data.
Aim at the existing market and the measurable base is the largest: the customers are all there, the behaviors are all there, the before-and-after comparison is laid out in plain view. Short-term orientation is precisely an advantage on this battlefield.
What about aiming at new markets? Hardest to attribute — and the first to be cut when budgets tighten.
Mount AI on your biggest existing business line, on the ground where value is easiest to prove.
The Denominator Is Yours to Control the Day You Sign
ROI is a fraction. The numerator is return; the denominator is cost.
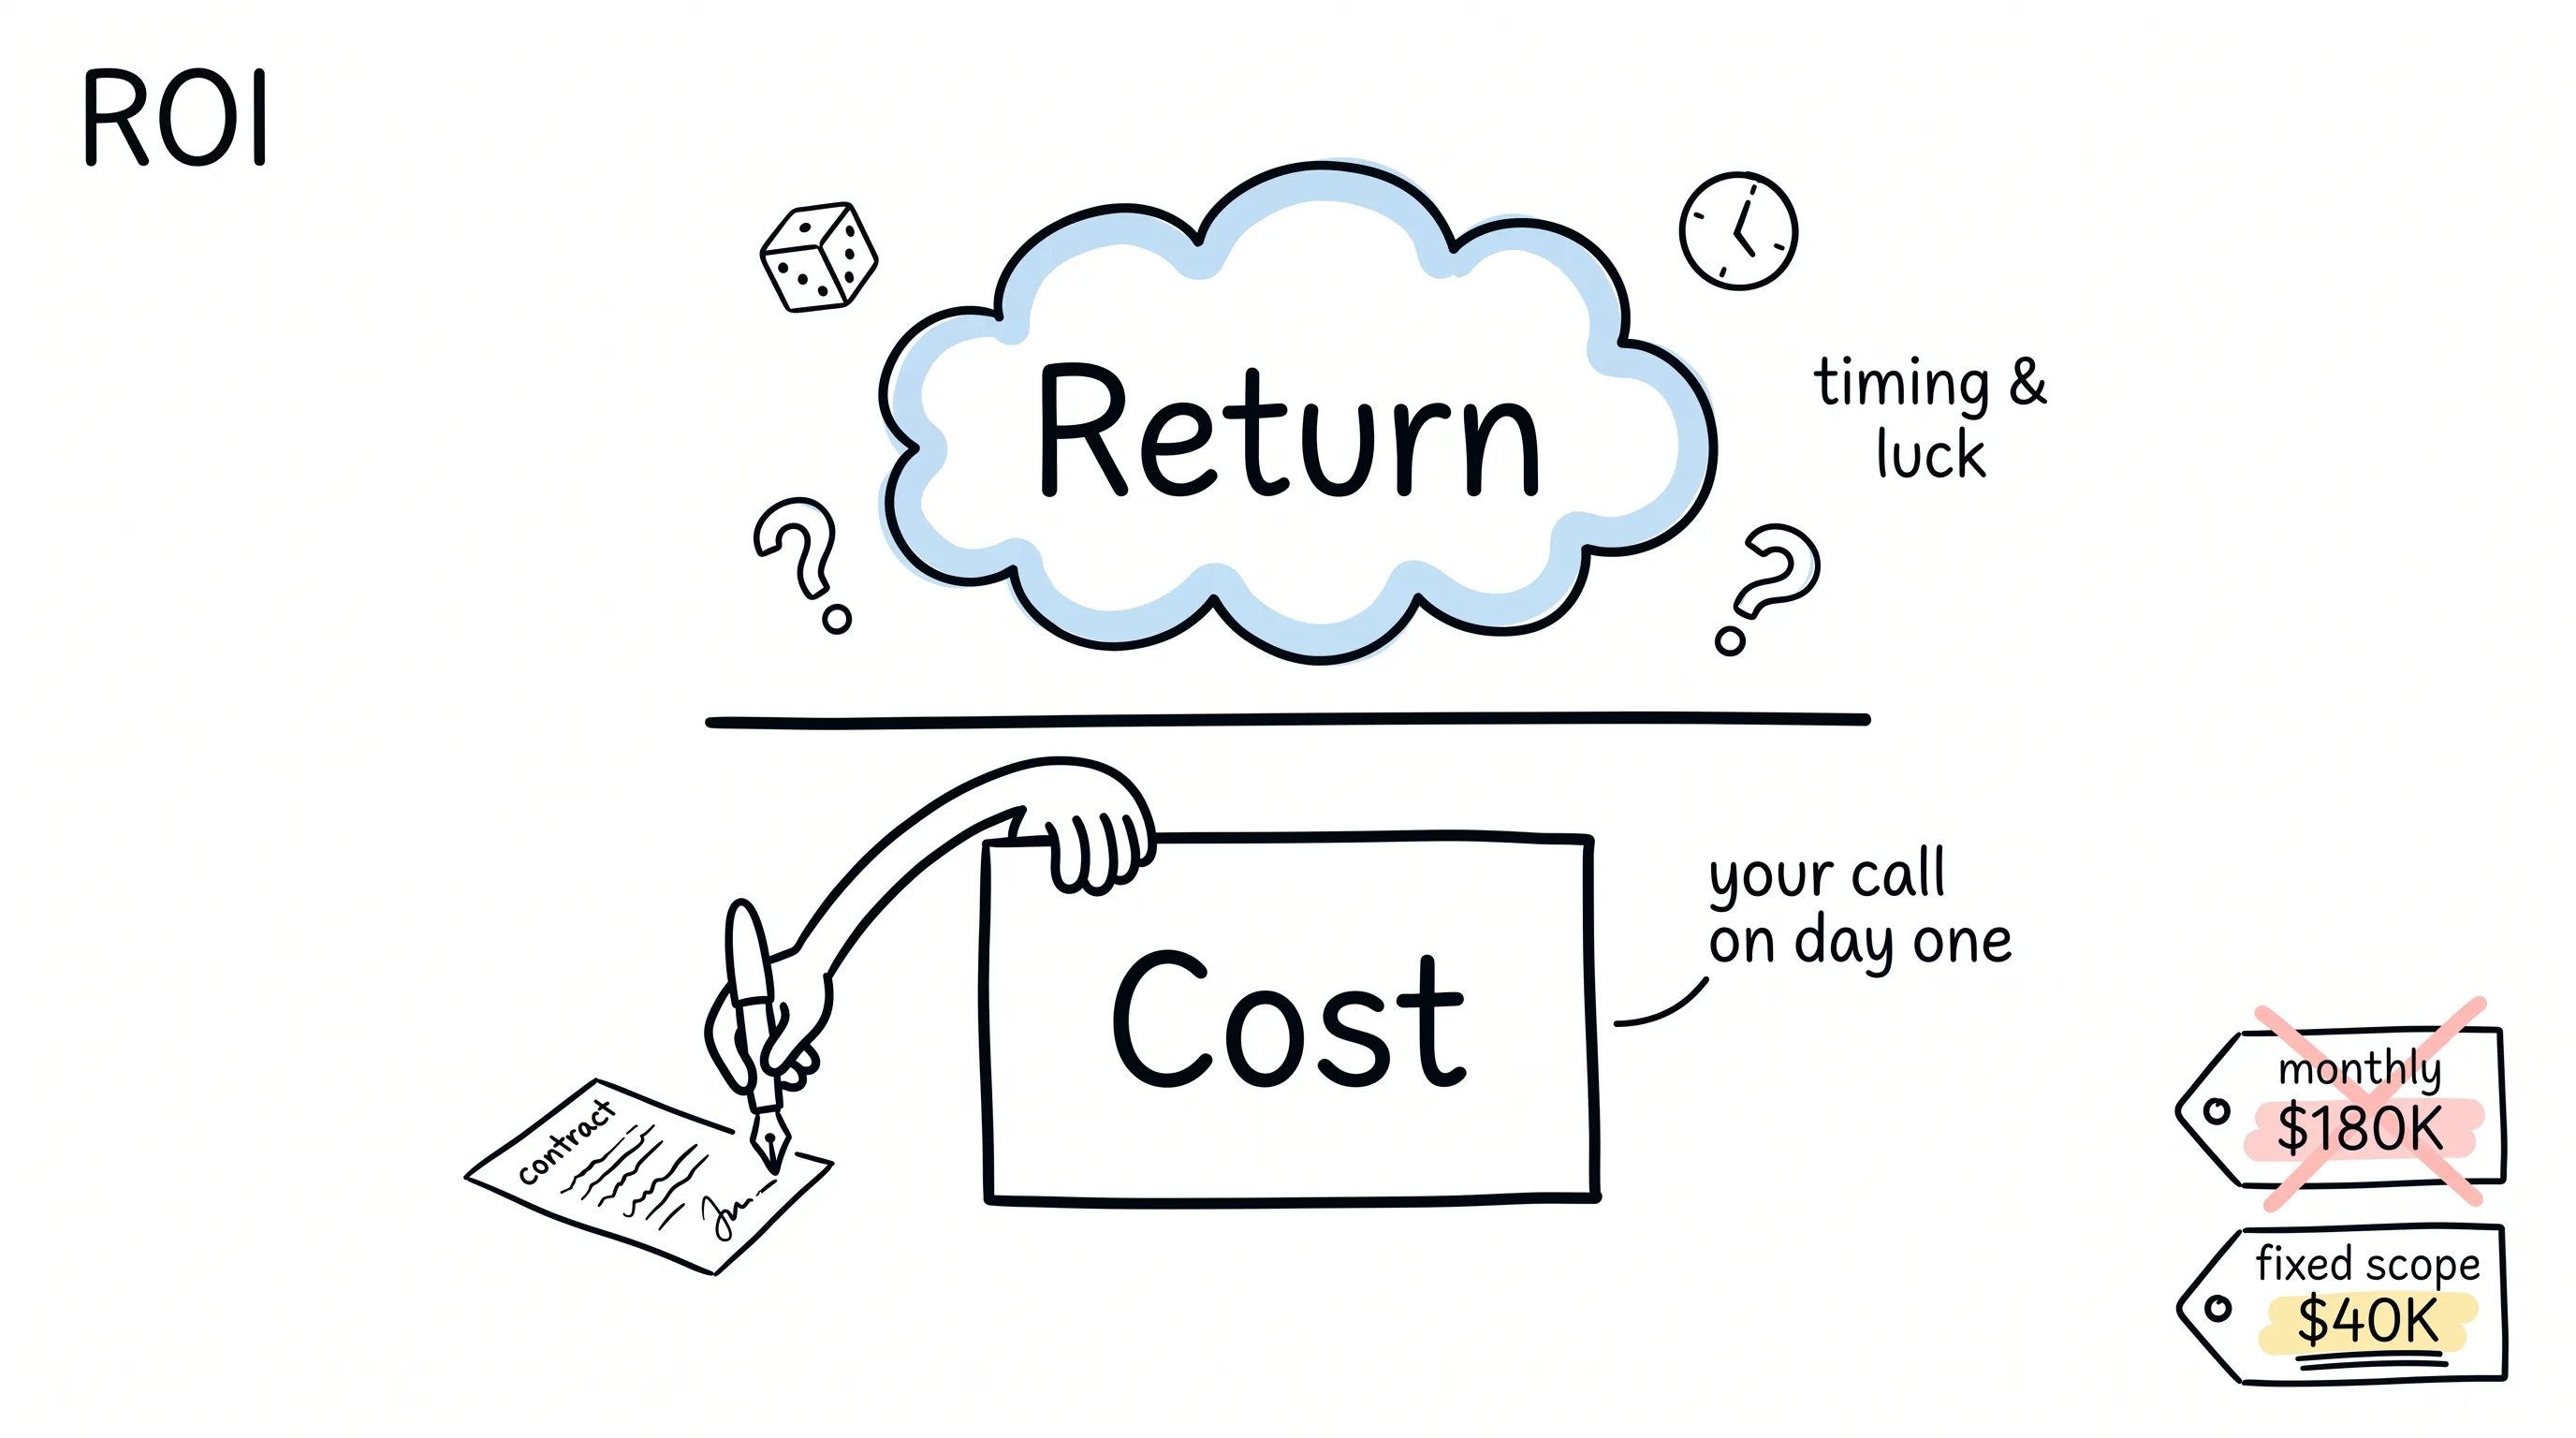
The numerator side depends on timing, luck, and the right people — beyond your control. The denominator side, from the day you sign, is entirely in your hands.
Fractional Pulse ran a comparison in 2026: for the same batch of project-type work, the pay-by-month consulting approach costs 4 to 5 times as much as fixed-scope delivery. $180,000 versus $40,000. Monthly consultants typically run $5,000 to $25,000 per month, and a signing commits you to 6 to 12 months; buying by project, the work is delivered in 4 to 24 weeks.
An example. Renovating your home, one way is to hire a contractor who bills monthly and works until you're satisfied; the other is this wall, this row of cabinets, this bathroom — one fixed price, finished and inspected.
Which one, you tell me, is likelier to get out of control?
The numerator may be beyond you; the denominator you can manage the day you sign.
The Cheapest Intervention Is Worth the Most
So is there a move that makes everything better without spending big money?
There is. Hold standing meetings.
In The CMO Survey, 71% of executives say agility is key, yet training budgets fell from 5.8% to 3.8%, and headcount expansion was cut in half. The squeeze is everywhere.
EOS Worldwide did a study covering 305 companies: companies that run the EOS system and also hired a professional facilitator grow 2.8 times faster.
Note: this is research done by the people who sell the system. Take the direction; discount the claim.
But there's a truth inside that doesn't get discounted with the brand: a standing meeting with a rhythm, an owner, and a number beats any tool.
Think about it: budgets up only 1.7%, training at just 3.8% — a weekly meeting where everyone reports against one number, what does it cost? Zero.
And it is the one move that makes every other number readable.
Before the Run Starts, Say It Clearly
Finally, here is an auditable battle map. Just five sentences:
- Baseline. Where the industry's scale sits: a median of 16 months. First put your own number on it and weigh it.
- Target. Aim at the top quartile, 10 months.
- Admit reality. Your measurement capability today is a 4.2, so freeze your metric definitions and name the owners before talking about anything else.
- Usage-based contracts get a usage cap written in. 56% of marketing technology spend bills this way; without one you're running naked.
- Buy phases, not monthly fees. For the same batch of work, renting people by the month runs 4 to 5 times more than buying the project outright.
So which AI use cases can truly be measured?
Content generation, 73.9% adoption — the easiest to count and the hardest to value: you can count each piece's cost and hours, but you can't count what it's worth. Personalization, 65.4% — keep one group of customers off it and prove the lift. Marketing automation, 48.9% — watch cycle time shrink. Audience targeting, 45.2% — test it directly against CAC and payback, benchmarked against the 16-month median. Generative engine optimization, 41.5% are at it — watch the share of AI answers that cite you. Data analysis, 46.3% — the hardest to attribute in isolation.
See? Ranked by "can it be measured" and ranked by "is it used a lot," you get two completely different leaderboards.
I have a rule of my own, and I'll share it: before the run starts, a project that can't say "which number, what cadence, compared to whom" is not an ROI experiment — it's research. Fund it like research, and stop calling it ROI.
Before signing the contract, ask three more questions:
Which number will move, and against which public benchmark? How often do you review? If the number doesn't move, what decision follows?
Median growth 9.9%, budget growth 1.7%. These days, there's no room for a fourth question.
A Closing Word
When that dinner ended, my friend said, now I've got a scale in my head.
I wish you the same scale.
Next time someone tells you an AI story, don't rush to be won over. Put them on that 16-month scale first: did the number move, compared to whom, how often is it weighed.
Those who can answer are partners.
Those who can't — take the story as a story.
May every dollar you spend on AI prove itself.
Continue reading
Related articles

Cross-Border Business: Time to Upgrade Your AI Toolbox
A learn article explaining how AI tools help cross-border e-commerce sellers clear five hurdles: language, regulation, logistics, payments, and fraud. It outlines a five-compartment toolbox, a five-step adoption path, and metrics such as conversion rate and CLV, while cautioning against over-reliance on AI.

AI Is Taking Over the Dirty Work of Social Media Marketing, One Task at a Time
This learn article outlines four social media marketing tasks AI can handle — audience analytics, content drafting and design, ad targeting and creative testing, and spam moderation — and cautions that taste, judgment, and data security remain human responsibilities.

AI Is Already This Good — Why Is Your Social Media Marketing Still Pure Manpower?
An overview of 18 AI tools for social media marketing, organized into six categories covering audience research, content creation, scheduling, comment and DM handling, ad management, and visual production, plus notes on personalization, prediction, and emerging trends.